Transformers are essential components of modern power distribution systems. Their failure can disrupt electricity supply, damage equipment, and compromise public safety. A common concern is whether utility companies are immediately aware when a transformer fails. With advancements in grid monitoring technologies and communication systems, the detection of transformer issues has become more efficient. This brief explores how transformer blowouts are detected, what mechanisms are in place for reporting and response, and the role of smart grid technologies in alerting power companies in real time.
What Happens When a Transformer Blows?
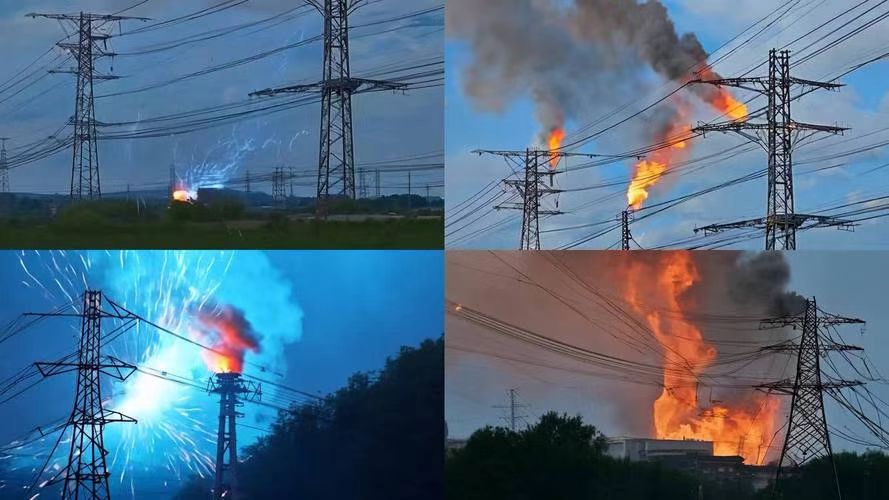
A loud, thunderous bang. Flickering lights. Plunging darkness. These are the telltale signs that a transformer has just blown. For residents and businesses, this moment means more than just an inconvenience—it signals a critical failure in the power infrastructure that may last hours or days. Transformer explosions are not just electrical events; they can cause environmental hazards, fires, and public safety emergencies. This article breaks down exactly what happens—both immediately and in the minutes and hours that follow—when a transformer blows.
When a transformer blows, it usually experiences a sudden internal failure due to electrical arcing, insulation breakdown, or thermal overload. This creates an explosive release of energy, often accompanied by a loud bang, fire, or smoke, followed by an automatic power shutdown. Nearby systems may also trip or sustain collateral damage, and emergency teams must isolate the unit to prevent further hazards.
Understanding what happens during and after a transformer blowout is crucial for operators, safety personnel, and even residents living near power lines or substations. This guide explains the technical sequence of events, visible signs, and systemic impact of a transformer explosion in-depth.
Transformer explosions only affect the local area immediately around the unit.False
Depending on the location and grid configuration, a transformer blowout can trip multiple substations, interrupt power across a city block, or destabilize a regional grid.
🔥 Immediate Effects of a Transformer Blowout
1. Electrical Arcing and Flashover
When the transformer fails, usually due to winding insulation failure, overload, or moisture ingress, the voltage exceeds dielectric capacity and causes:
- Internal arc discharge
- Rapid heating and gas formation (hydrogen, acetylene, methane)
- Expansion and rupture of the tank or bushings
| Event | Result |
|---|---|
| Internal arc | Fireball or explosion |
| Oil contact with arc | Ignition, flame burst |
| Core or winding short | Total energy release |
2. Sound and Light Signature
A blown transformer produces a distinct explosive sound—often described like a shotgun or firework. Other immediate sensory effects include:
- Blue-white flash from the arc
- Dense gray or black smoke from burning oil
- Vibration or rumble felt nearby
3. Automatic Circuit Isolation
Modern substations are equipped with:
- Buchholz relays for gas detection
- Overcurrent relays for fault tripping
- Differential protection to isolate the unit
These trigger within milliseconds to disconnect:
- The primary supply
- Secondary distribution systems
- Nearby equipment under shared loads
| Timeframe Post-Blowout | Event Description |
|---|---|
| 0–0.2 seconds | Arc formation, breaker trip |
| 0.2–2 seconds | Smoke/fire, isolation signal issued |
| 2–30 seconds | Alarms activated, SCADA log alerts |
| 30 sec – 5 min | First responders dispatched |
4. Oil Fire and Smoke Emission
Transformers contain mineral oil for cooling and insulation. When the arc hits the oil:
- It vaporizes instantly
- Oil ignites, burning at up to 1,200°C
- Flames may rise several meters high
Common Fire Hazards:
- Ignition of bushings or tap changers
- Explosion of tank caps or oil conservators
- Fire spread to nearby lines or structures
| Fire Type | Extinguishing Method |
|---|---|
| Oil surface fire | CO₂ or foam suppression |
| Internal arc flash | Automatic inerting (if equipped) |
| Bushing flare-up | External water mist system |
⚡ Impact on the Power Grid
A. Local Outages and Voltage Drop
Depending on the transformer’s role:
- Distribution transformers (11kV/400V) cause neighborhood outages
- Power transformers (66kV–400kV) may black out entire districts
The grid may experience:
- Sudden voltage dips
- Unbalanced load shifts
- Relay misoperations or cascading trips
B. Equipment Chain Reactions
Adjacent equipment may fail due to:
- Overvoltage backfeed
- Surges through neutral or ground
- Flame contact or structural impact
| Component | Possible Reaction Post-Blowout |
|---|---|
| Circuit breakers | Trip on fault current surge |
| Busbars | Experience mechanical stress |
| Cables | Burn or melt from arc proximity |
| CT/PT equipment | Lose insulation, fail accuracy |
📊 Technical Breakdown of Transformer Blowout Phases
| Stage | Physical Effect | Timeframe |
|---|---|---|
| Pre-Fault Stress | Winding overheating, gas rise | Hours to days |
| Dielectric Failure | Breakdown of insulation | Milliseconds |
| Arc Initiation | Arc formed between windings | Microseconds |
| Explosion/Fire | Oil flashover, pressure release | <1 second |
| Trip/Isolation | Circuit breakers disengage | 0.1–1 second |
| Damage Spread | Fire, gas leak, casing rupture | Minutes |
🔎 Detectable Aftermath of a Blowout
After a transformer blows, the site will exhibit:
- Charred bushings and cracked insulators
- Leaking or burning oil
- Ruptured tank or radiators
- Burn marks on cables or fence posts
Field indicators:
| Indicator | Meaning |
|---|---|
| Smoke with burning odor | Internal oil fire |
| Loud popping after blast | Continued arcing or secondary faults |
| Fluid on ground | Oil tank rupture |
🧯 Emergency Response and Safety Protocols
A. First Steps
- Isolate the area – Minimum 30 meters (100 feet)
- Activate emergency response – Fire suppression, spill control
- Notify utility control center
- Evacuate nearby personnel
B. Fire Containment Measures
- Use transformer-rated CO₂ or foam
- Shut down HV and LV supplies
- Prevent oil from entering sewers or soil
🏗️ Recovery and Restoration Timeline
| Step | Estimated Timeframe |
|---|---|
| Site securing and investigation | 2–6 hours |
| Root cause analysis | 1–2 days |
| Transformer decommissioning | 1–2 weeks |
| Replacement unit transport/install | 2–4 weeks |
| Full restoration | Up to 1 month or more |
How Do Power Companies Monitor Transformers?
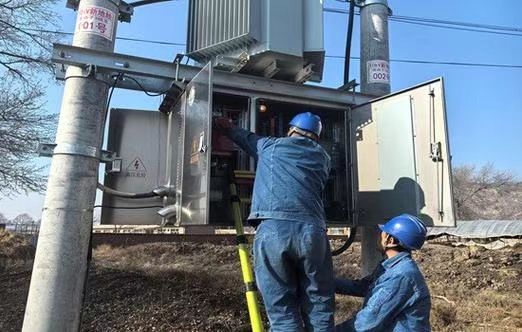
Transformer failures can be catastrophic, leading to massive outages, equipment damage, or even fires. With the increasing demand on the grid and the aging of infrastructure, utility companies can no longer afford reactive maintenance. That’s why modern power companies rely heavily on continuous transformer monitoring systems to detect early warning signs, prevent failures, and optimize asset longevity. But what exactly do they monitor, and how?
Power companies monitor transformers using a combination of real-time systems including Dissolved Gas Analysis (DGA), thermal imaging, SCADA systems, partial discharge sensors, oil quality analyzers, and bushing monitors. These systems work together to track temperature, gas generation, insulation integrity, load performance, and structural integrity—helping engineers identify emerging faults before they become catastrophic.
Monitoring isn’t just a safety measure—it’s a financial and operational strategy. This article will explore the full suite of transformer monitoring techniques, what data they collect, and how utilities analyze it to prevent transformer blowouts and extend asset life.
Transformer monitoring is only required for high-voltage power transformers.False
While high-voltage transformers are a priority, distribution transformers are also increasingly being monitored with IoT sensors to improve grid reliability and reduce maintenance costs.
🎯 Why Monitor Transformers?
The main goals of transformer monitoring are:
- Early fault detection (thermal, electrical, or mechanical)
- Predictive maintenance planning
- Prevention of unplanned outages
- Real-time health analysis
- Regulatory compliance and grid stability
Unmonitored transformers are at risk of:
- Sudden insulation failure
- Undetected overheating
- Oil degradation
- Explosions due to undiagnosed faults
🔍 1. Key Parameters Monitored in Transformers
| Parameter | Faults Detected | Tools Used |
|---|---|---|
| Oil temperature | Overload, cooling failure | Thermocouples, RTDs, fiber-optics |
| Winding temperature | Overheating, hot spot formation | Fiber-optic temperature probes |
| Dissolved gases in oil | Arcing, overheating, insulation burnouts | Online DGA analyzers |
| Moisture in oil | Insulation breakdown risk | Capacitive moisture sensors |
| Bushing insulation & leakage | Surface tracking, flashover risk | Bushing monitors (tan delta, capacitance) |
| Partial discharges (PD) | Internal corona, insulation degradation | UHF sensors, acoustic sensors |
| Load current and voltage | Overload detection, voltage drops | SCADA-integrated CT/PT systems |
| Vibrations | Mechanical looseness or winding movement | Accelerometers, AE sensors |
🧠 2. Monitoring Technologies Used by Power Companies
A. Dissolved Gas Analysis (DGA)
DGA is the primary method for detecting internal faults. Gas sensors track:
- Hydrogen (H₂) – general fault indicator
- Methane (CH₄), Ethylene (C₂H₄), Acetylene (C₂H₂) – thermal/arcing faults
- Carbon monoxide (CO) – paper insulation degradation
| Fault Type | Gas Pattern |
|---|---|
| Arcing | High C₂H₂, moderate H₂ |
| Thermal fault | Elevated C₂H₄ and CH₄ |
| Insulation burn | Rising CO and CO₂ |
Tool Used:
- Multi-gas online DGA sensors (e.g., Kelman, Vaisala, Morgan Schaffer)
- Laboratory testing for verification
B. Thermal Monitoring (Online and Offline)
Monitoring includes:
- Top oil temperature sensors
- Winding hot spot temperature via fiber optics
- Thermal cameras for external scanning
| Temperature Anomaly | Interpretation |
|---|---|
| +20–30°C above norm | Overload or cooling system issue |
| Localized hotspot | Internal winding or bushing fault |
🔍 Utilities often integrate thermal monitoring with SCADA to trigger alarms.
C. Partial Discharge (PD) Monitoring
PD is a sign of insulation breakdown. Techniques include:
- UHF antennas in transformer tank
- Acoustic sensors mounted externally
- TEV (Transient Earth Voltage) probes
Applications:
- Detect corona inside bushings
- Identify loose windings or insulation voids
- Pinpoint locations for offline inspection
D. Bushing Monitoring
Bushings are prone to moisture ingress, thermal stress, and aging. Monitoring includes:
- Capacitance change tracking
- Tan delta (power factor) measurement
- Surface leakage current monitoring
| Tan Delta Reading | Interpretation |
|---|---|
| <0.5% | Normal |
| 0.5% – 1.0% | Warning – aging detected |
| >1.0% | Critical – replacement due |
E. Online Oil Quality Monitoring
Oil sensors check for:
- Dielectric strength
- Water content
- Temperature and viscosity
- Oxidation indicators
Key Devices:
- Vaisala MHT410, Weidmann InsuLogix G2
- Inline filters with data collection modules
F. Vibration and Acoustic Monitoring
Transformer structure issues like core vibration, winding displacement, or tap changer chatter are detected via:
- Accelerometers
- Acoustic Emission (AE) devices
- Sound spectrum analysis
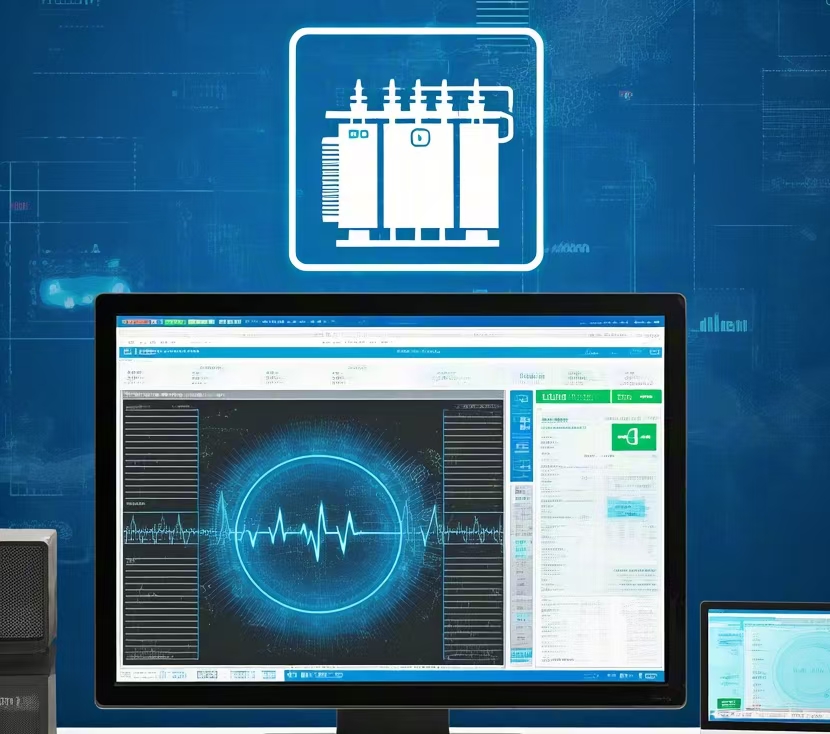
📡 3. Centralized Monitoring Platforms
All transformer data is relayed via:
A. SCADA (Supervisory Control and Data Acquisition)
- Real-time alerts for temperature, load, DGA thresholds
- Event logs and trend charts
- Remote breaker tripping or control of cooling systems
B. AEMS (Asset and Energy Management Systems)
- Predictive analytics using AI/ML
- Maintenance scheduling based on transformer condition
- Integration with GIS, ERP, and inventory systems
| System | Role |
|---|---|
| SCADA | Real-time control and alarm response |
| AEMS | Asset lifespan optimization |
| IoT Gateway | Connects sensor to cloud/server |
📊 Monitoring Data Summary Table
| Sensor Type | Measures | Critical Values (Examples) |
|---|---|---|
| DGA Sensor | C₂H₂ > 35 ppm = arcing | Action needed |
| Hotspot Fiber Probe | >110°C = insulation hazard | Reduce load, investigate |
| Bushing Monitor | Tan δ > 1.0% = severe aging | Replace bushing |
| Moisture Sensor | >30 ppm = insulation at risk | Dry oil, investigate leakage |
| IR Thermal Camera | Hotspot > 20°C above ambient | Perform close inspection |
🛠️ Integration and Maintenance Strategy
Condition-Based Maintenance (CBM)
- Replace or repair based on condition metrics, not calendar dates
- Cuts down costs and downtime
- Used for critical transmission and power transformers
Scheduled Online Monitoring
| Monitoring Cycle | Tools Activated | Outcome |
|---|---|---|
| 24/7 | SCADA, DGA, oil temperature | Real-time safety |
| Weekly Reports | PD, tan delta, capacitance logs | Health trend tracking |
| Quarterly Review | Data analytics and AI patterns | Predictive maintenance planning |
What Role Does the Smart Grid Play in Detection?

Traditional power systems operated reactively—waiting for a transformer or substation to fail before deploying crews. However, transformer failures can result in fires, power outages, and major asset losses. The introduction of the smart grid has completely transformed this approach. With built-in communication, edge intelligence, and real-time analytics, the smart grid plays a pivotal role in early fault detection, condition monitoring, and grid stability. This article explores exactly how the smart grid contributes to transformer monitoring, predictive maintenance, and overall system resilience.
The smart grid enables early transformer fault detection through real-time data acquisition, two-way communication, edge analytics, and automated alerts. It integrates sensor data from transformers—like temperature, load, gas levels, and insulation condition—into centralized platforms that analyze patterns, predict failures, and trigger maintenance before catastrophic faults occur.
If you want to understand how utilities catch transformer problems early and avoid massive blackouts, it all begins with the smart grid’s detection capabilities.
The smart grid only benefits urban areas with advanced infrastructure.False
The smart grid is being implemented in both urban and rural areas to enhance grid reliability, manage distributed generation, and improve transformer monitoring everywhere.
⚡ Key Smart Grid Functions in Transformer Detection
The smart grid consists of a layered architecture that combines hardware, software, communication protocols, and intelligent systems. Here’s how it enables transformer fault detection:
1. Sensor Integration at the Edge
Smart grid-connected transformers are equipped with:
- IoT-enabled DGA sensors
- Thermal monitoring devices
- Partial discharge detection units
- Bushing monitors and oil analyzers
These sensors stream real-time data to control centers or cloud platforms, enabling continuous asset visibility.
| Smart Grid Sensor Type | Data Captured |
|---|---|
| Thermal sensors | Oil and winding temperature |
| DGA analyzers | Hydrogen, acetylene, methane |
| PD sensors | Internal discharge activity |
| Moisture/oil sensors | Humidity, viscosity, TAN levels |
| Load sensors | Real-time current, voltage, harmonics |
2. Two-Way Communication Networks
The smart grid uses high-speed wireless, fiber optic, or mesh communication protocols (e.g., IEC 61850, IEEE 802.15.4) to:
- Transmit sensor data to control centers
- Receive commands for automatic breaker trips
- Trigger alerts for transformer load anomalies
| Communication Tier | Purpose | Example Protocols |
|---|---|---|
| Field Layer | Sensor data collection | Modbus, DNP3, CANbus |
| Substation Layer | Equipment control and coordination | IEC 61850, MMS |
| Backhaul Layer | Central system integration | TCP/IP, LTE, Ethernet |
3. Edge Computing and Data Filtering
Modern smart grid nodes feature embedded processors that perform data analysis locally, reducing latency and preventing unnecessary cloud overload. These edge devices:
- Detect abnormal temperature spikes
- Filter out background noise in PD signals
- Initiate pre-alarm conditions
- Rank fault severity based on historical profiles
Real-world benefit:
A smart grid transformer in Germany used edge analytics to isolate a bushing with increasing tan delta values—triggering early removal before a blowout occurred.
4. AI-Powered Predictive Analytics
Smart grid platforms use machine learning algorithms to analyze historical and real-time data. These algorithms:
- Identify patterns in gas evolution, load profiles, and vibration
- Predict remaining useful life (RUL) of insulation or bushings
- Generate health indices and dynamic risk scores
- Recommend maintenance actions automatically
| Predictive Output | Use Case |
|---|---|
| Health Index | Asset replacement prioritization |
| Fault Probability Score | Risk-based maintenance scheduling |
| Anomaly Detection Alerts | Immediate inspection trigger |
5. Automated Alarm and Isolation Systems
When fault thresholds are breached, the smart grid can:
- Automatically open breakers or isolate transformers
- Send SMS/email alerts to operators
- Record event logs for root cause analysis
- Initiate fire suppression or pressure relief protocols if integrated
Typical Smart Alarm Thresholds:
| Parameter | Warning Level | Critical Level | Smart Grid Action |
|---|---|---|---|
| Winding temperature | >90°C | >105°C | Load reduction command |
| Acetylene (C₂H₂) | >10 ppm | >35 ppm | Immediate shutdown alert |
| Tan delta | >0.7% | >1.0% | Bushing replacement notice |
🧠 Visualization and Decision Support Systems
Smart grids present data through advanced visualization platforms:
- GIS-based transformer location tracking
- Color-coded health maps
- Trend graphs for temperature, gas, and PD values
- Alarms categorized by urgency (Info, Warning, Critical)
| Visualization Tool | Functionality |
|---|---|
| SCADA Dashboard | Real-time monitoring, control |
| Health Index Map | Transformer condition heatmap |
| Event Timeline Viewer | Sequences fault progression analysis |
📊 Smart Grid Transformer Detection Process Flow
| Stage | Action Taken by Smart Grid |
|---|---|
| 1. Sensor triggers | Detects early signs of failure |
| 2. Data transmission | Securely relays via mesh/fiber |
| 3. Edge analysis | Filters, scores, and ranks the fault type |
| 4. Central AI processing | Predicts severity, correlates with past data |
| 5. Alert dispatch | Sends alarms to teams or initiates shutdown |
| 6. Maintenance initiated | Field crew dispatched with fault insight |
🔄 Integration with DER, EVs, and Load Management
The smart grid also considers distributed energy resources (DER) like solar and wind, and variable transformer loads from electric vehicle (EV) charging.
Transformer monitoring in a smart grid environment includes:
- Load forecasting using AI to avoid overloading
- Reverse current detection from inverter-based systems
- Adjustment of tap changers via voltage regulation commands
| Integration Type | Smart Grid Detection Role |
|---|---|
| EV Fast Charging Hub | Detect transformer overheating risk |
| Solar Inverter Output | Balance voltage variation on secondary side |
| Load Shedding Zones | Auto-isolate transformer before overload |
Do All Blown Transformers Trigger Automatic Alerts?
When a transformer blows, utility operators often receive an alert almost instantly—assuming the system is equipped to detect and transmit that information. But does every blown transformer automatically trigger an alert? Not necessarily. Whether or not an alert is issued depends on the transformer’s monitoring infrastructure, the extent of damage, and the type of power network it is part of. Understanding which failures are automatically detected and which might go unnoticed is critical for maintenance teams and utility providers.
Not all blown transformers trigger automatic alerts. While high-voltage and smart-grid-integrated transformers typically have sensors and SCADA systems to detect and report failures instantly, many low-voltage distribution transformers—especially older or rural units—lack built-in detection systems, meaning some failures go unreported until visually identified or service complaints arise.
This has major implications for outage response time, safety risk mitigation, and network reliability. Let’s explore how transformer alerting works, what systems trigger notifications, and where gaps may still exist.
All transformers automatically notify utility companies when they blow.False
Only transformers equipped with monitoring sensors and connected to SCADA or smart grid systems can issue automatic alerts; many legacy and rural units lack this capability.
🧠 How Automatic Alerts Work
1. Sensor-Driven Detection
Transformers equipped with modern sensors can automatically detect fault conditions such as:
- Sudden temperature spikes
- Excessive gas buildup in oil (DGA)
- Partial discharges
- Bushing failure or pressure surge
- Oil leaks or fire initiation
These sensors are connected to communication modules that instantly trigger alerts via:
- SCADA (Supervisory Control and Data Acquisition)
- IoT cloud platforms
- Mobile maintenance apps
- Email/SMS alert gateways
| Condition Detected | Alert System Triggered | Response Type |
|---|---|---|
| Sudden high temperature | Thermistor or RTD | SCADA or edge alarm |
| Acetylene spike in DGA | Online gas monitor | SMS/email fault notification |
| Arc detection | PD/UHF sensor | Auto-breaker trip + alert |
| Pressure surge | Buchholz relay or PRD | Audible + digital SCADA alert |
2. Breaker and Relay Response
In many grid-connected transformers, protective relays (overcurrent, differential, Buchholz) will:
- Trip breakers
- Log the fault
- Transmit a coded signal to central control or mobile terminals
If these relays are networked, the control center sees:
- The exact time of trip
- Nature of the fault
- Transformer ID and location
Example: A Buchholz relay triggers during gas accumulation from arcing. This causes an automatic SCADA notification, closes the oil diverter valve, and logs the fault in the grid monitoring software.
3. Smart Grid Integration
Transformers part of a smart grid environment always trigger alerts when they blow because:
- Sensors report conditions 24/7
- AI systems predict and pre-flag fault risks
- Communication is two-way and redundant (mesh, fiber, 4G/LTE)
Smart grid-enabled units can even trigger proactive alerts before a full blowout by detecting:
- Rising DGA trends
- Overloading patterns
- Worsening bushing tan delta values
| Smart Grid Capability | Detection Type | Alert Mechanism |
|---|---|---|
| Predictive analytics | Fault probability score | Email/report to dispatch |
| Real-time sensors | Condition monitoring | SCADA fault flash alert |
| Edge computing | Onboard alarm filtering | Cloud push notification |
⚠️ When Alerts May Not Be Triggered
Despite advancements, many transformers still do not trigger automatic alerts. Common scenarios include:
A. Legacy Distribution Transformers
- Found in older or rural networks
- Lack embedded sensors or RTUs
- Rely on customer outage complaints or field patrols for detection
- May be in service for 30+ years without upgrades
B. Offline or Failed Sensors
- Sensor failure or calibration drift may prevent detection
- Broken communication links or radio silence
- Relay contact issues (e.g., dirty contacts) preventing trip signal
| Scenario | Result |
|---|---|
| Transformer blows, no sensors | No alert—field team discovers visually |
| RTU powered down | Fault not transmitted |
| Monitoring set to manual polling | Delay in alert transmission |
📊 Table: Alert Response Readiness by Transformer Type
| Transformer Type | Typical Monitoring Level | Automatic Alert Likelihood |
|---|---|---|
| High-voltage grid transformer | Full SCADA + DGA + PD | 100% |
| Medium-voltage substation | SCADA + Temp/DGA | 80–95% |
| Distribution transformer (urban) | Basic load/temp sensor | 40–60% |
| Pole-mount rural transformer | None or basic fuse only | <30% |
🛠️ How to Ensure Alerts Are Always Triggered
Utilities are increasingly adopting:
- Retrofit sensor kits for older transformers
- IoT modules with cellular/M2M comms
- Cloud SCADA for distributed monitoring
- Edge AI controllers with pre-set alarm rules
Best Practices:
- Equip each transformer with at least thermal and gas monitoring
- Connect monitoring devices to automated SCADA or cloud
- Regularly test sensors and relays for functionality
- Use battery backups or solar-powered RTUs for remote sites
How Quickly Can a Utility Respond to a Transformer Blowout?
Transformer blowouts are critical incidents that can cause immediate power loss, damage to nearby systems, and in rare cases, even fires or explosions. The speed and efficiency with which a utility company responds to such events directly impacts customer satisfaction, safety, and system reliability. However, not all transformer failures are detected or addressed at the same speed—response time can range from minutes to hours, depending on several factors. So, what determines how quickly a utility can react when a transformer blows?
Utilities can respond to a transformer blowout within 15 to 45 minutes in urban and high-priority zones with smart grid integration and automatic alerting, while response times in rural or legacy-infrastructure areas may range from 1 to 4 hours or more due to manual detection, dispatch limitations, and accessibility challenges.
Understanding the full picture of transformer blowout response helps infrastructure managers, stakeholders, and customers set realistic expectations—and drives decisions about upgrades and modernization. This article breaks down the detection-to-restoration timeline, the influencing factors, and how technology accelerates response efficiency.
Utility companies respond to all transformer blowouts within 15 minutes.False
Response times vary significantly based on detection systems, location, time of day, and resource availability. Urban smart-grid zones may see sub-30-minute responses, but rural areas can take hours.
🚨 Typical Transformer Blowout Response Timeline
Let’s analyze the step-by-step phases of how utilities respond once a transformer failure occurs.
| Phase | Time Estimate (Urban/Smart Grid) | Time Estimate (Rural/Legacy Grid) |
|---|---|---|
| Fault detection | 0–1 minute (automated) | 15–60 minutes (manual/patrol-based) |
| Dispatch decision | 1–5 minutes | 30–90 minutes |
| Crew mobilization | 10–20 minutes | 30–60 minutes |
| Arrival on site | 15–45 minutes | 1–2 hours or more |
| Initial fault isolation | 5–10 minutes | 10–30 minutes |
| Full repair or replacement | 2–6 hours (on average) | 4–12 hours (depends on transformer type) |
🧠 Key Factors That Influence Response Speed
1. Real-Time Detection Capability
The faster a utility learns about a blowout, the faster it can act.
- Smart grid-connected transformers send automatic alerts
- Legacy transformers rely on field reports, 911 calls, or customer complaints
| Detection Type | Avg Time to Alert | Tools Used |
|---|---|---|
| SCADA/DGA monitoring | <1 minute | RTUs, online sensors, alarms |
| IoT edge controllers | 1–5 minutes | Cloud platform, mobile alerts |
| Manual report (visual) | 15–60 minutes | Patrol, customer call center |
2. Location and Accessibility
Urban and suburban areas have:
- Shorter travel distances for crews
- Easier equipment access
- Denser technician coverage
In contrast, rural sites may be hours away, involve rugged terrain, and require special vehicles or equipment to access.
3. Availability of Replacement Equipment
A transformer blowout may require:
- Temporary bypass or isolation
- Fusing or sectionalizing
- Full transformer replacement
If the utility has spare units or mobile substations ready nearby, response is faster. If parts must be transported from a distant warehouse, delays increase.
4. Time of Day and Day of Week
- Nighttime or weekend blowouts can take longer if crews are on-call instead of on-shift
- Holidays may see delayed mobilization or limited personnel
🛠️ Real-World Case Study Comparison Table
| Location | Detection Method | Crew Dispatch Time | Total Downtime |
|---|---|---|---|
| Chicago, IL | Smart grid alert (SCADA) | 10 min | 1.5 hrs |
| Austin, TX | Customer report via app | 35 min | 3.5 hrs |
| Yakima, WA | Patrol discovered fire | 90 min | 7 hrs |
| Savannah, GA | Edge device auto-alert | 20 min | 2 hrs |
🧩 How Utilities Accelerate Response Times
A. Smart Grid + SCADA Integration
- Enables instant fault detection and location
- Preemptive isolation of faulted transformer before damage spreads
- Load rerouting or microgrid segmentation to reduce outage footprint
B. Mobile Workforce Management (MWFM)
- GPS dispatching of nearest available crew
- Real-time updates from the field
- Prioritized job queues for faster triage
C. Onsite Spares and Mobile Substations
- Reduce wait times for parts
- “Hot swap” ability for pad-mounted and pole transformers
- Often used in mission-critical zones (e.g., hospitals, data centers)
📊 Urban vs Rural Transformer Response Comparison
| Feature | Urban/Smart Grid Area | Rural/Legacy Infrastructure |
|---|---|---|
| Detection time | <1 minute | 15–60 minutes |
| Notification method | Auto alert via SCADA | Customer report or patrol |
| Dispatch speed | Fast (crew density high) | Moderate to slow (limited crews) |
| Repair resource availability | High | Variable |
| Avg total restoration time | 1–3 hours | 4–10 hours |
🔧 Restoration Complexity Based on Damage Severity
| Transformer Damage Level | Required Action | Time to Restore |
|---|---|---|
| Fuse or bushing blown | Component swap | 1–2 hours |
| Internal arcing | Full transformer replacement | 3–8 hours |
| Fire-damaged unit | Site cleanup + new install | 8–24 hours |
| Explosion with cable burn | Extensive infrastructure rebuild | 24+ hours |
Can Customers Report Transformer Failures?
Transformer failures often occur suddenly—with loud bangs, sparks, or localized power outages. While utilities have invested in smart grid technology to detect many of these issues automatically, it’s still critical for customers to play a role in reporting failures—especially in areas with aging infrastructure or limited monitoring. Whether you hear a loud explosion, see a smoking pole, or lose power without warning, knowing how and when to report a transformer failure can make a real difference in response time and safety.
Yes, customers can and should report transformer failures. Utilities often rely on customer reports—especially in areas without smart grid monitoring—to quickly identify outages, damaged transformers, or unsafe conditions. Reporting can be done via mobile apps, utility websites, emergency hotlines, or automated SMS services, and helps initiate faster response and repair.
Customer vigilance complements automated systems, especially in locations where detection devices are outdated or offline. Understanding the available reporting methods empowers customers to act quickly and responsibly during grid failures.
Only utility staff can report transformer failures to the power company.False
Customers are encouraged to report visible or audible signs of transformer failure, such as smoke, fire, explosions, or outages, through official communication channels to help utilities respond more efficiently.
🧠 Why Customer Reports Are Still Essential
1. Gaps in Detection Coverage
Even in modern networks, not all transformers are equipped with automated fault sensors or SCADA-connected relays. Especially in:
- Rural areas
- Pole-mounted transformers
- Legacy infrastructure (20+ years old)
Customer calls may be the first and only alert the utility receives about a failure.
2. Multiple Types of Reportable Events
Customers might observe:
- A loud pop or explosion
- Flames or smoke from a transformer
- Sparks, arcing, or burning odor
- Power loss affecting a neighborhood segment
- A damaged pole, box, or wires on the ground
These signs are critical to report immediately—even if the power returns—because they may signal ongoing internal damage or safety risks.
📱 Common Ways Customers Can Report Failures
| Reporting Method | Description | Availability |
|---|---|---|
| Utility mobile app | Real-time outage reporting, geotagging | Widely available |
| Customer service hotline | 24/7 phone support for emergency alerts | Always active |
| Utility website portal | Web-based forms with map-based selection | Internet required |
| SMS reporting systems | Text keyword (e.g., “OUT”) to utility number | Requires enrollment |
| Social media (emergency) | Tweet/message utility with outage details | Varies by utility |
Example:
A residential customer in Florida uses a mobile app to report a loud explosion and burning smell from a pole-mounted transformer. The app captures GPS data, notifies dispatchers, and flags the incident as “critical.” Crews are dispatched within 25 minutes based on the report.
🛠️ What Information Should Customers Provide?
To help utilities respond effectively, customer reports should include:
| Information Needed | Example or Detail Provided |
|---|---|
| Exact location | Street address or nearby landmark |
| Description of event | “Loud bang, smoke from green box” |
| Time of occurrence | “Occurred at 6:20 PM” |
| Presence of fire/sparks | “Sparks and glowing wires visible” |
| Whether power is still out | “No electricity since event” |
| Any injuries or property damage | “Tree limb fell on transformer” |
Most mobile apps automatically log the report, generate a ticket number, and provide estimated repair time.
📊 Table: Reporting Method Efficiency by Area Type
| Area Type | Most Effective Reporting Method | Notes |
|---|---|---|
| Urban/smart grid | Mobile app or automated SMS | Integrated with outage maps |
| Suburban | App + website form | Often augmented with call centers |
| Rural | Phone hotline | Direct connection with dispatch |
| Commercial zones | Customer service desk or phone hotline | Priority response for high-load sites |
🧠 Utility Response Triggered by Customer Reports
Once a report is submitted, the following actions may occur:
- System cross-check: Utility checks SCADA or sensor data to confirm
- Crew assignment: Mobile workforce receives location, event description
- Asset flagging: Transformer ID tagged for follow-up inspection
- Follow-up contact: Customers may receive update SMS or call
- Restoration ETA issued: System provides estimate if part of known outage
🚨 Common Mistakes Customers Should Avoid
- Delaying reports hoping the issue resolves
- Assuming someone else has reported the same problem
- Getting too close to sparking or smoking equipment
- Reporting vague or inaccurate locations
Always prioritize safety.
If you see signs of danger (fire, downed wires), call emergency services (911) in addition to the utility.
📉 Impact of Customer Reporting on Response Time
| Factor | Without Customer Report | With Timely Customer Report |
|---|---|---|
| Time to detect transformer fault | 15–60 mins | <10 mins |
| Dispatch initiation | Delayed or manual trigger | Immediate flagging |
| Crew arrival window | 2–4 hours possible | Often within 1 hour |
| Risk mitigation | Higher (fires, outages) | Lower |
📋 Utility Case Study: PG\&E Smart Report Integration
- PG\&E receives over 30% of initial transformer failure alerts from customer mobile reports
- These reports feed into a triaged SCADA dashboard, cross-referenced with grid analytics
- Report-to-response window improved from 90 minutes to 25 minutes on average
- Customer satisfaction scores increased 15% after enabling GPS-based app reporting
Conclusion
Yes, in many cases, power companies do know when a transformer blows, especially if it is part of a monitored grid system. Modern utilities utilize Supervisory Control and Data Acquisition (SCADA) systems, smart meters, and fault indicators to detect abnormalities instantly. However, in less connected or rural areas, detection might depend on manual reporting or delayed indicators like customer outages. As smart grids continue to evolve, real-time transformer monitoring is becoming more universal, minimizing blackout durations and improving response effectiveness.
FAQ
Q1: Does the power company automatically detect when a transformer blows?
A1: In most modern systems, yes. Power companies use smart grid technology, remote sensors, and automated fault detection systems to identify transformer failures in real time. These systems instantly alert operators when voltage drops, current surges, or equipment malfunctions.
Q2: What methods do utility companies use to detect transformer failures?
A2: Utilities may use:
SCADA (Supervisory Control and Data Acquisition) systems for real-time equipment status.
Smart meters that report sudden power loss or irregularities.
Breaker or fuse trips that signal abnormal power flow.
Customer outage reports as supplemental alerts in less automated areas.
In advanced grids, the response is almost instantaneous.
Q3: What happens after a transformer blows?
A3: Once detected, the utility company:
Dispatches a field crew to confirm the fault.
Isolates the affected line to prevent further damage.
Replaces or repairs the blown transformer.
Restores power to affected customers as quickly as possible.
Response time varies by area and outage size.
Q4: What if the power company doesn’t have automatic detection?
A4: In areas lacking advanced monitoring, they rely on:
Manual patrols and inspections.
Customer phone calls or online outage reports.
Voltage monitoring substations to pinpoint fault zones.
These methods may delay response but are still effective for identifying and fixing transformer issues.
Q5: How can customers help identify transformer failures?
A5: You should report if you observe:
Loud bang or flash near power poles.
Power outage localized to a small area.
Smoke or fire from utility boxes.
Call your utility's emergency line and avoid the area until professionals arrive.
References
"Smart Grid Systems and Outage Detection" – https://www.energy.gov/articles/how-smart-grid-improves-power-reliability
"How Utilities Know There’s an Outage" – https://www.duke-energy.com/outages/how-we-respond
"What Happens When a Transformer Blows?" – https://www.electrical4u.com/blown-transformer-causes-and-response
"Outage Management Systems (OMS) Explained" – https://www.gegridsolutions.com/oms
"SCADA for Utility Monitoring" – https://www.siemens.com/global/en/products/energy/scada-for-utilities.html
"Smart Meters and Utility Data Feedback" – https://www.smartenergygb.org/how-smart-meters-work
"Transformer Fault Detection Technology" – https://ieeexplore.ieee.org/document/7432134
"Xcel Energy: Responding to Equipment Failures" – https://www.xcelenergy.com/outages_and_emergencies/outage_information/how_we_restore
"PG&E Outage Response Process" – https://www.pge.com/en_US/outages/how-we-respond.page
"Understanding Utility Fault Reporting" – https://www.utilitydive.com/news/how-utilities-detect-and-respond-to-faults